
Optimal Opps
Finding optimal ratios for conversion factors on slide rules
Introduction
Several years ago I was working on a prototype radar system that measured the speed of objects in units of meters per second. At one point there was a need to convert a handful of the measurements from meters per second to miles per hour for a spot check. I happened to have a Fullerton 1450 Acudial circular slide rule with me, which is a rebranded Concise 28N, probably the most common circular slide rule ever made.1 I decided to put it to work. With one setting of the dial, I would have a conversion table where I could read miles per hour on one scale opposite meters per second on a second scale.
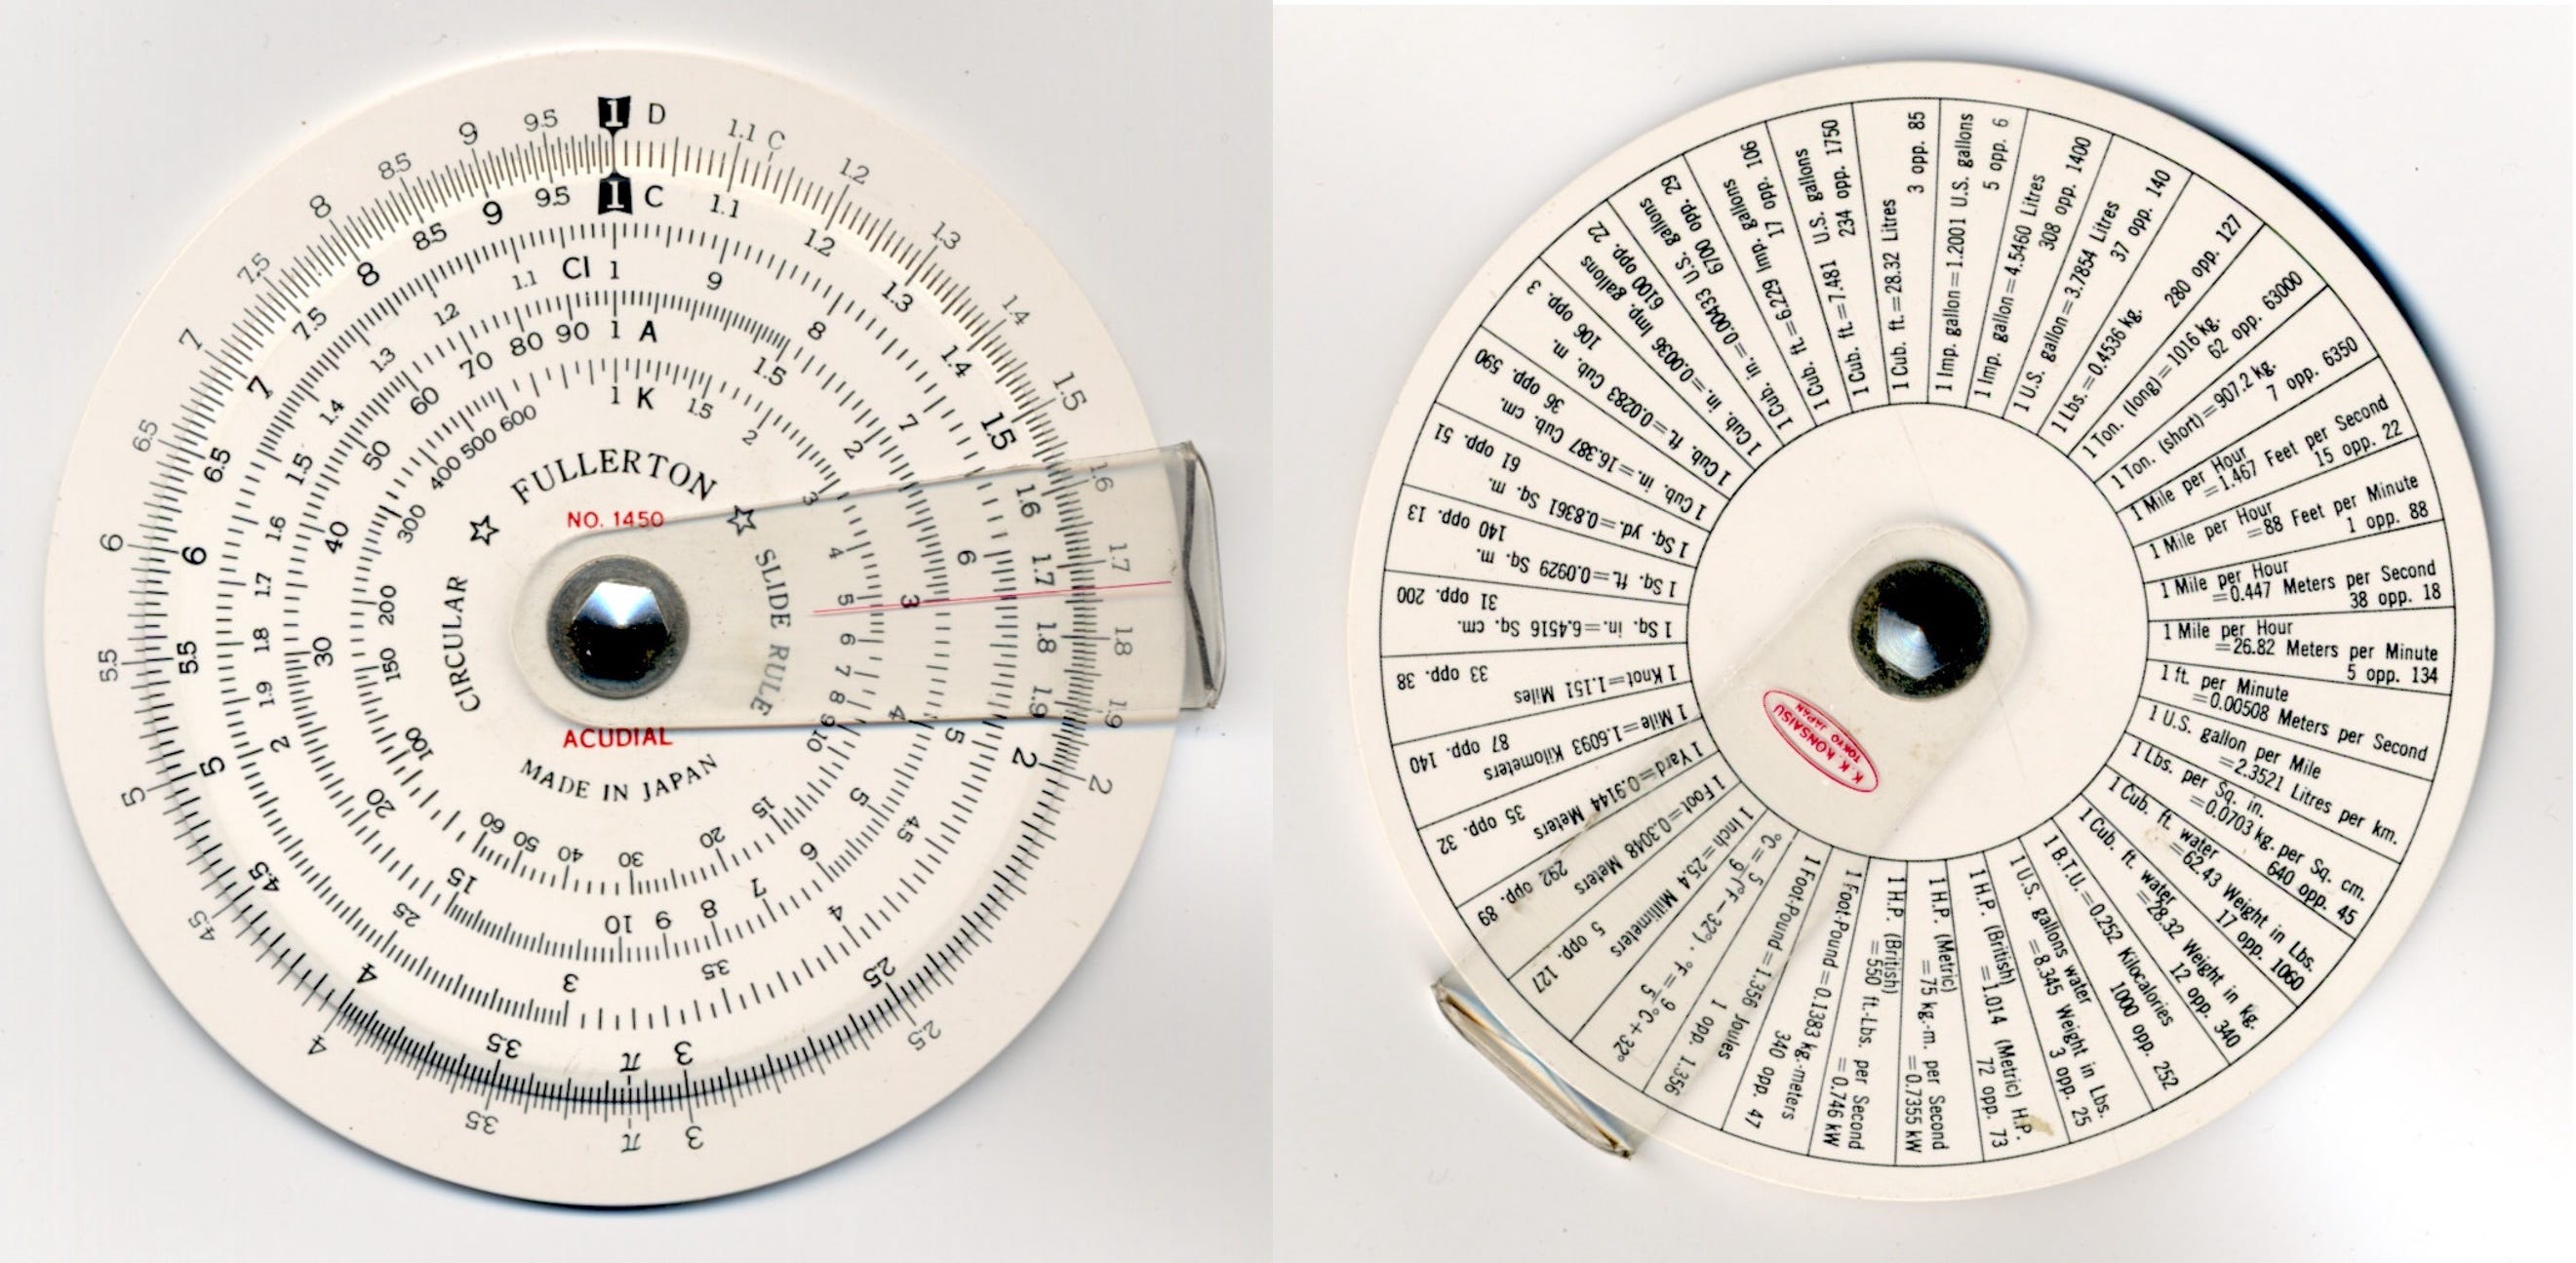
As can be seen in the picture, the back of the Concise 28N has a table of conversion factors. Each entry has a decimal conversion factor and a pair of integers that approximate the decimal value as a ratio. Many simplex slide rules have similar tables on the back of the rule. The integers are often written in the form d opp. n, where opp stands for opposite.
The slide rule can be set up to do the conversion either by moving the C index opposite the conversion factor on the D scale, or by forming the ratio n/d by placing d on the C scale opposite n on the D scale. The integer ratios are provided because it is often easier and more accurate to place the tick marks corresponding to the integer values directly opposite one another than to find the decimal value on one of the scales, which could require interpolation between tick marks to accurately set the slide.
One of the conversions listed in the table on the back of the Concise 28N happens to be meters per second to miles per hour - how very convenient! The conversion information on the rule is:
1 Mile per Hour = 0.447 Meters per Second
38 opp. 18
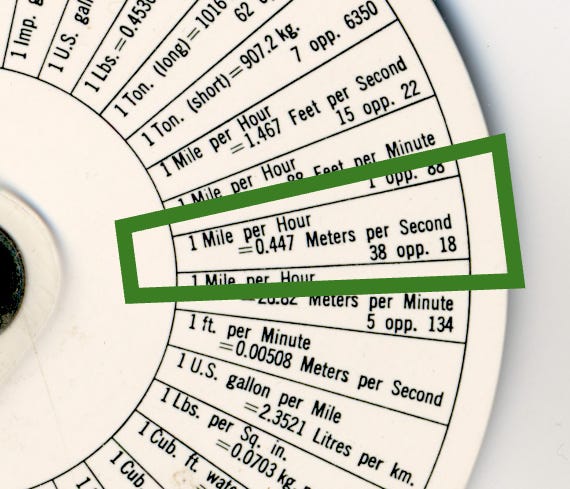
I duly placed 38 on the C scale opposite 18 on the D scale and converted several measurements from meters per second to miles per hour. The values were pretty much in line with what I was expecting.
When I later entered the measurements into a spreadsheet and used a formula to convert the measurements to miles per hour using the 0.447 conversion factor, I noticed that the earlier conversions using the slide rule were all off by around 5 percent.
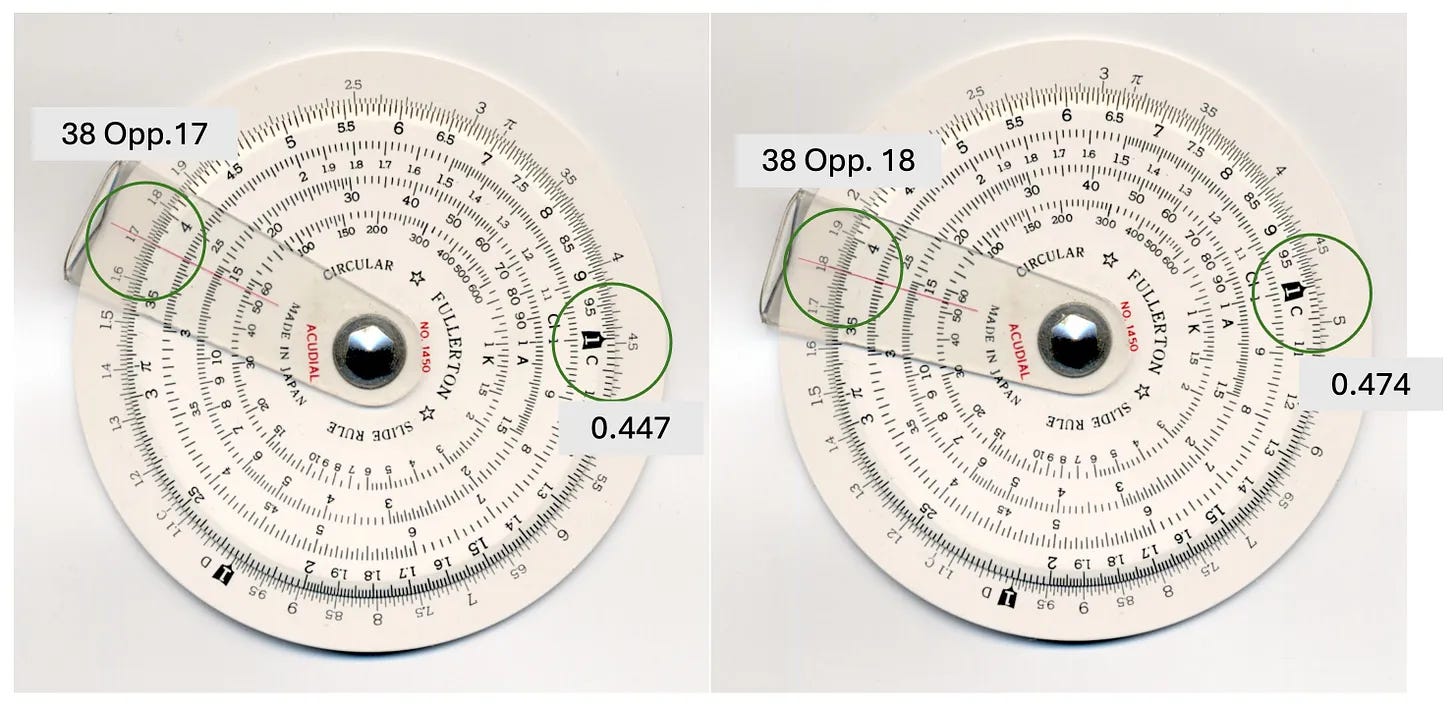
I quickly figured out why there was a discrepancy. The ratio 18/38 does not equal 0.447. Instead, it equals 0.474. These two values differ by 5.9% - definitely not slide rule accuracy.
A more accurate ratio for 0.447 is 17/38, which equals 0.44736… This is much closer to the actual conversion factor of 0.44704…, the relative difference is less than 0.1%, which is generally considered the limit of slide rule accuracy for 25cm scales. Both of these ratios are shown in the next picture.
It was very surprising to find this large of an error on such a popular rule. I thought that maybe I had an early version of the rule and that perhaps this was fixed in a later production run. The more recent models of the Concise 28N did sort of fix the problem by removing the integer ratios from the table, and only showing the conversion factors. But of the many, many Concise 28N rules I have looked at with conversion tables showing ratios in the form X opp. Y, all have this exact same error.2
I later learned that Concise was not the original designer of the 28N. The 28N is a clone of an earlier British rule, the Blundell S140, and its successor the Blundell Academy 310.3 The 28N and the Blundell rules are essentially identical, with very similar fonts, scale layouts and annotations, and the very same conversion table. And yes, the Blundell rules also have the same error. Amazingly, this error persisted for many tens of years and was never corrected by either Blundell or Concise.
Determining Conversion Factor Ratios
So, how could this error have come about? I have never come across any accounts of how slide rule manufacturers determined suitable ratios to approximate conversion constants. Of course, since electronic computers were not widely available at that time, good ratios would have to be determined manually.
One likely way this was done is to use the slide rule itself. Simply place the C scale index opposite 0.447 on the D scale, then scan along the scales to find pairs of tick marks that are aligned opposite each other.
Could the unknown Blundell employee tasked with identifying ratios for inclusion in the conversion table on the Blundell S140 have simply misread the tick mark opposite 38 as 18 instead of 17? On many slide rules, including the Concise 28N, the tick mark is clearly labeled as 1.7, so that seems unlikely. However there are slide rules where the tick mark is not labeled, so this is a possibility.
More likely, the last two digits of the conversion factor were swapped before looking for a suitable ratio, causing the C index to be placed opposite 0.474 instead of 0.447. The value of 18 would have been correctly read opposite 38, but by then it was too late - the damage had already been done.4
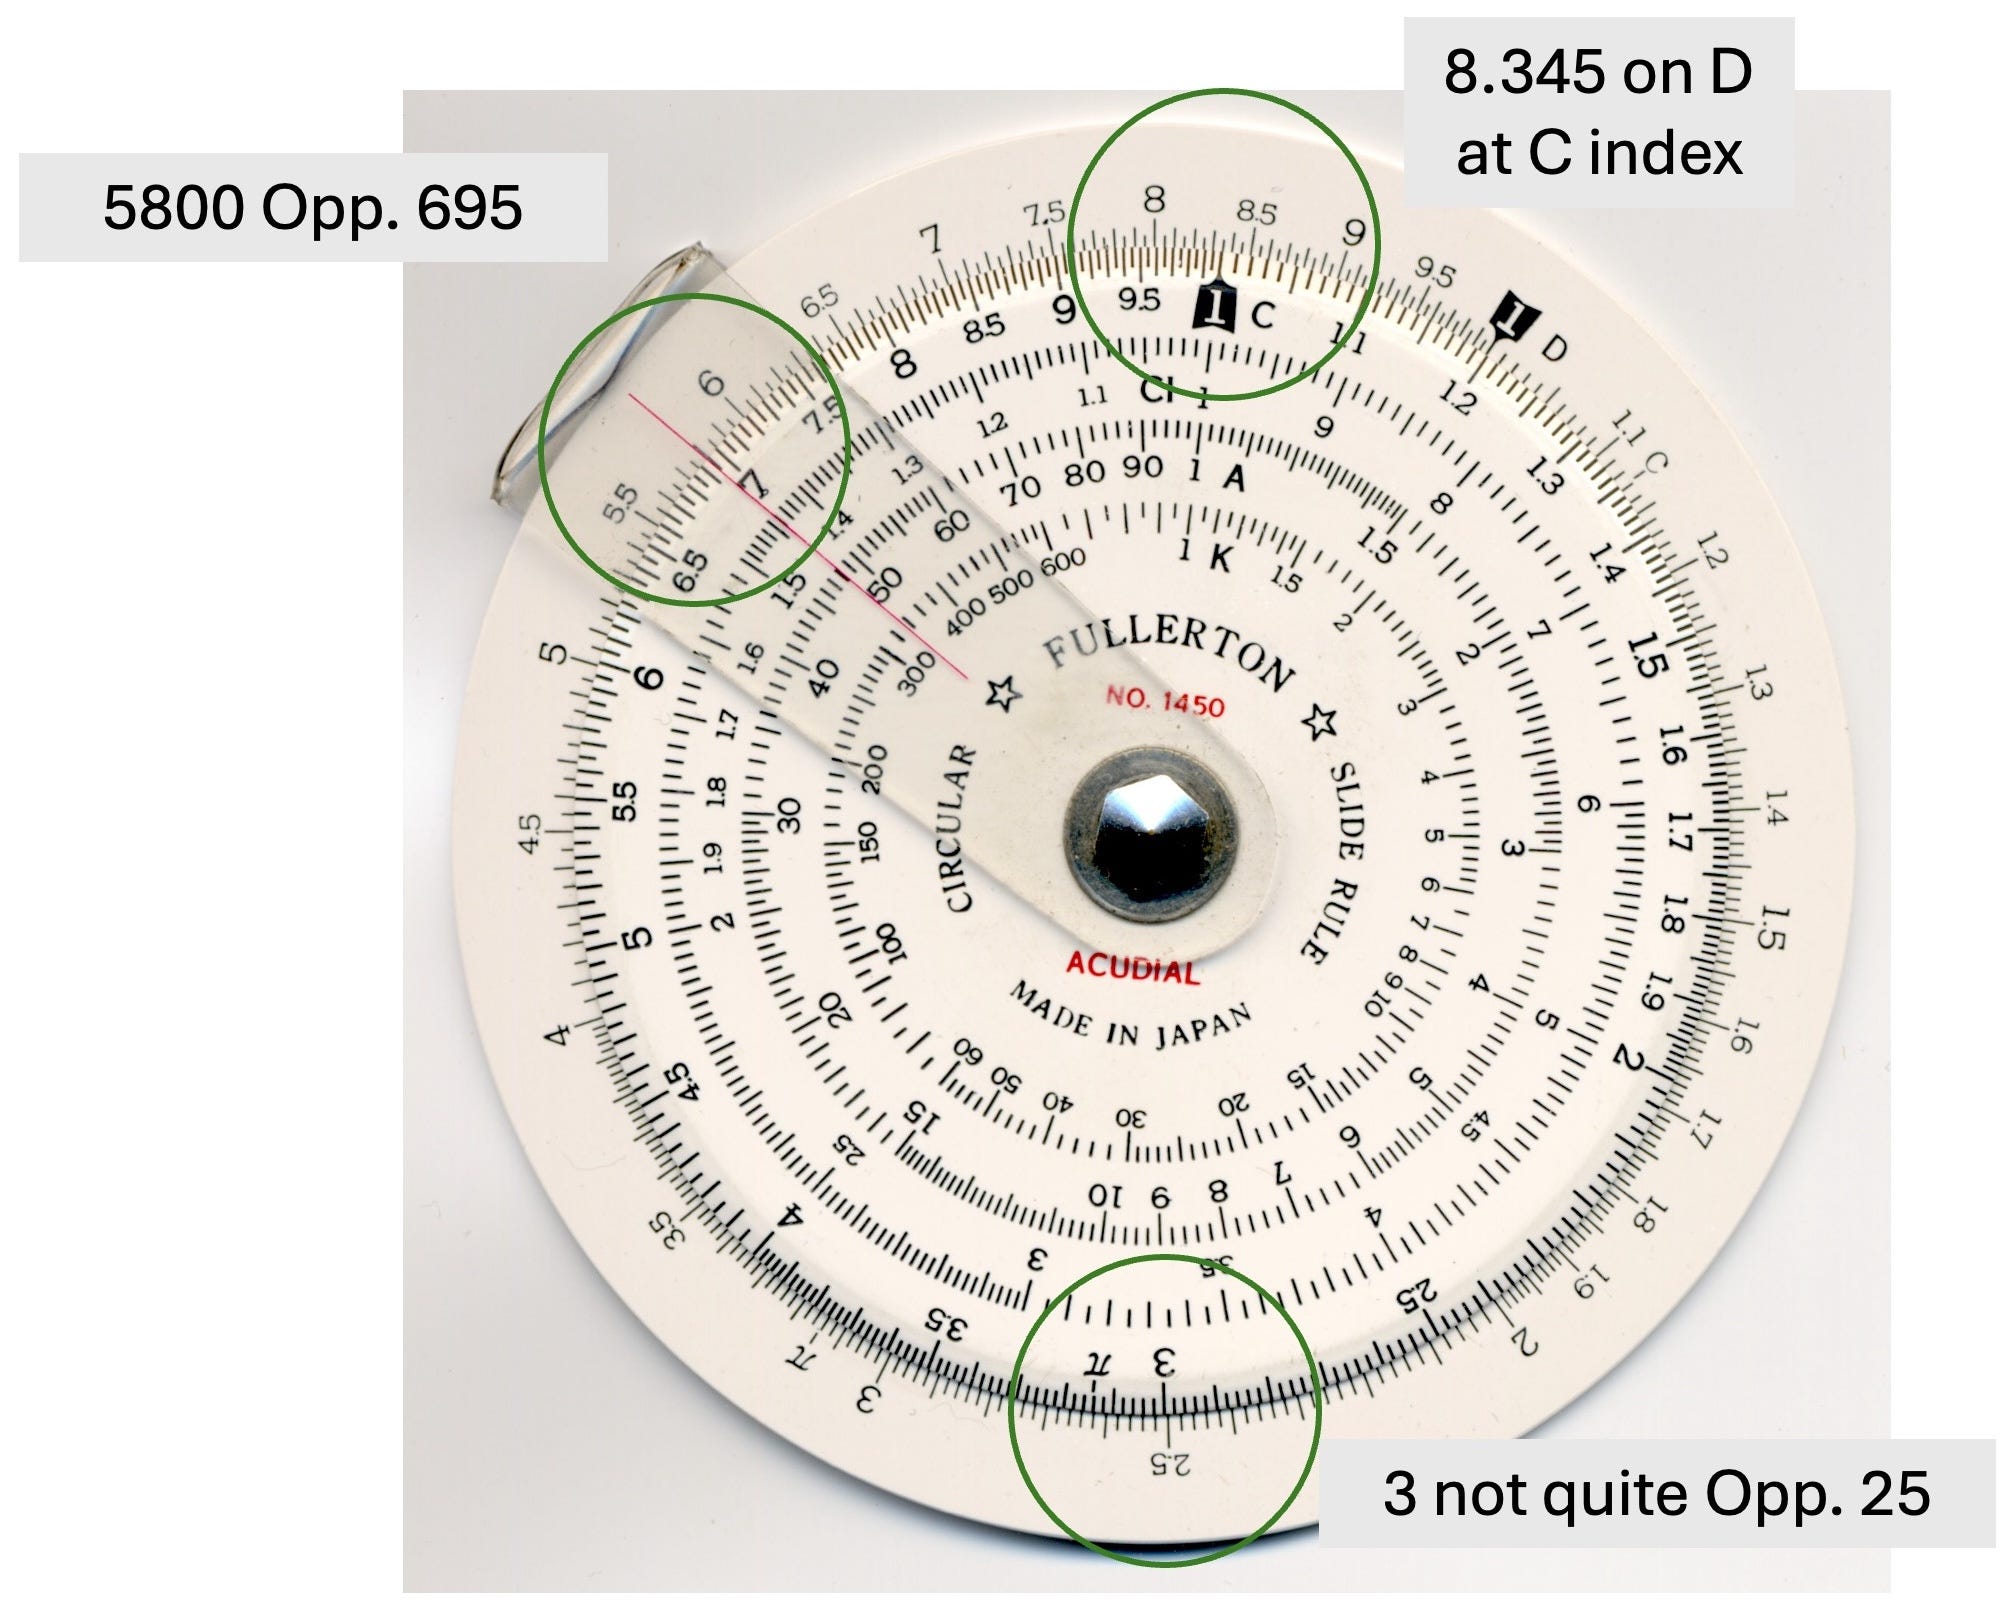
Since I discovered one error in the 28N conversion table, I decided to check the other conversions to see how accurate they were. Fortunately there were no other egregious errors. The next largest error in a conversion ratio that I found is for the ratio for converting U.S. Gallons of water to weight in pounds. The table says place 3 opp. 25, which gives a ratio of 8.3333. The decimal value shown is 8.345, so the ratio has a relative error of 0.144%.
This is much better than the error in the miles per hour to meters per second conversion ratio. But it’s actually a bit worse than generally accepted slide rule accuracy and results in an slide rule slide offset that is visible to the naked eye. As we shall see, a much better approximation for 8.345 is 5800 opposite 695, which has a relative error of 0.0009%, or 9 parts per million. In fact, this is the most accurate approximation possible using the tick marks that appear on standard 25cm C and D scales. When we set this ratio on the C and D scales, we can clearly see that the 25 and 3 tick marks are not aligned with each other.
Optimal Ratios
What are the ‘best’, or most optimal pairs of tick marks for a given ratio? There are at least a two ways in which ratios could be considered optimal:
The most accurate ratio for a given decimal value.
The easiest to set ratio for a given decimal value that has an error less than some threshold.
Let’s take a look at how each of these ratios might be found.
Most Accurate Ratio
Let’s consider that we have a decimal value x that we want to approximate with a ratio of two numbers n and d (for numerator and denominator). To find the most accurate ratio, we need find values of n and d where n/d = r is closest to x.
What does closest mean? In this case closest means the ratio that has the least linear distance between the position of r and the position of the x on a logarithmic slide rule scale.
At first glance it seems that we could just compute |x - r|, to determine how close x is to r.5 However, this gives incorrect results when the values are on a logarithmic scale. For example, let’s suppose that we want to approximate the value 2.00 and we are comparing two ratios, r1 = 1.00 and r2 = 3.00. In this case we have |x - r1| = 1.00 and |x - r2| = 1.00. In other words, the absolute differences between the desired value x and each ratio are the same.
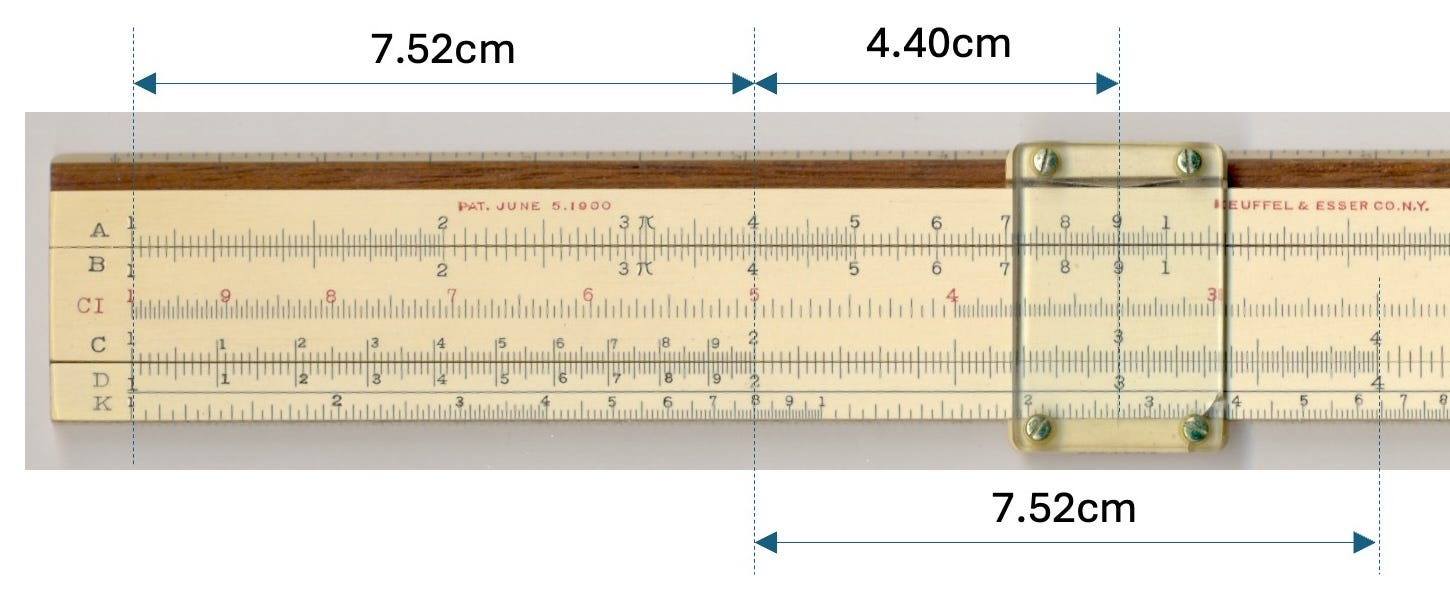
However, the distance between 1.00 and 2.00 on a 25cm logarithmic slide rule scale is 7.52cm. The distance between 2.00 and 3.00 is 4.40cm.6 So on a logarithmic scale 3.00 is closer to 2.00 than it is to 1.00, as shown in the figure below.
Since the distance between two values on a logarithmic scale is proportional to the ratio of the two values, a better measure to use is the relative accuracy: (max(x, r) / min(x, r)). Note that we always put the maximum of x and r in the numerator and the minimum of x and r in the denominator when computing relative accuracy to ensure that we get the same result regardless of which value is larger.
For example if we are comparing the ratios r1 = 1.00 and r2 = 4.00 as approximations for 2.00, then the relative accuracy for r1 is 2.00 / 1.00 = 2.00, and for r2 is 4.00 / 2.00 = 2.00. And sure enough both 1.00 and 4.00 are the same physical distance from 2.00 on a logarithmic slide rule scale, as shown in the previous figure.
Since many of the ratios of interest will have n and d close to each other, the values of r will all be close to 1.00. To make it easier to interpret the comparisons, we can subtract 1.00 from the value max(x, r) / min(x, r). The value that remains is called the relative error.
The relative error is typically written as a decimal value, or as a percentage. However, we will mainly be dealing with relative errors of 0.001 (0.1%) or less, which I find awkward to deal with. For example, I find it difficult to get a feel for the size of the difference between, for example, 0.042% and 0.0094%.
In this case, I find it more intuitive to express the relative error in parts per million (ppm). The relative error in ppm between a ratio r and a desired value x is given by the formula:
relative_error = 1,000,000 * (max(x, r) / min(x, r) - 1)
0.1% = 1000ppm is what is typically considered to be slide rule accuracy for a 25cm log scale. 100ppm is 10 times better than than that. 10,000 ppm is 10 times worse. Written as ppm the relative accuracies of 0.042% and 0.0094% become 420ppm and 94ppm respectively, which I find to be much easier to interpret.
To find the most accurate ratio we can cycle through all the values of n and d, and compute the corresponding value of r. We then compute the relative error as shown above and select the ratio with the lowest relative error.
Easiest to Use Ratio
While setting different ratios on C and D scales, I also noticed that some ratios were easier to align than others. For example, numbers with only one or two significant digits are easier to locate on the slide rule scales then numbers with three digits. If numbers placed opposite each other have just one or two digits each, and they provide sufficient accuracy then they generally are a better ratio for slide rule use, than a more accurate ratio where the numerator and denominator are both three digit numbers.
In order to find the easiest to use ratio, we need a way to measure and compare the ease of use of a ratio. For this exercise, the ease of use metric I chose is the sum of the number of significant digits in the numerator n and denominator d. Ratios with a lower ease of use score are generally easier to set on a slide rule scale than those with a higher ease of use score.
We also need to specify a relative error threshold that is ‘good enough’ for an easiest to use ratio. Any ratio r that approximates x with a relative error below the threshold is a candidate ‘good enough’ ratio.
While 0.1%, or 1000ppm is generally considered slide rule accuracy for 25 cm slide rule scales, I find that I can make out differences between the position of values with this relative difference. When the relative difference is 250ppm or lower, then the position of the slide rule scale is virtually indistinguishable.
To find the easiest to use ratio, we can cycle through all the combinations of n and d, and find all the ratios where the relative error is lower than the selected threshold. We then compute ease of use score for each ratio. The ratio(s) that have the lowest ease of use score are those that are easiest to use for the given accuracy threshold.
Computing the Optimal Opps.
I wrote a computer program in Python to identify the optimal values to use for any given ratio, using each of the definitions of optimal above. The program code is given at the end of the article.
The program is based on the tick marks on a typical 25cm single decade logarithmic scale, i.e., the typical C or D scale. On the majority of slide rules I looked at, the C and D scales have 321 tick marks. Between 1 and 2, there are tick marks for every increment of 0.01. Between 2 and 4, there are tick marks for every increment of 0.02. And between 4 and 10, there are tick marks for every increment of 0.05, as seen in the next figure.

Since it doesn’t matter if we use 1 or 10 in a ratio, we really only have 320 tick marks to choose from. With 320 marks on the C scale and 320 marks on the D scale, there are 320 * 320 = 102,400 ratios that can be created.
Of course many of the computed ratios give the same decimal value. For starters, there are 320 ratios that give the value 1.00, i.e., 100/100, 101/101, etc.7 We also need to treat ratios that differ by multiples of 10x as the same value. For example, the ratio 2 / 5 = 0.4 is considered to be the same as 8 / 2 = 4.0. To handle this, the program works with normalized ratios, where each ratio is normalized to the range 1.0 to 10.0. This is done using the formula:
where floor function returns the closest integer that is lower than the value in parentheses.
For efficiency, the program pre-computes all 102,400 normalized ratios, and groups those ratios that are the same. Finding the optimal ratios for a given value then becomes an exercise in looking up the nearest computed ratios and retrieving the numerator, denominator pairs for that ratio. The program identifies all ratios that have the same normalized ratio and creates a lookup table where the normalized ratios are sorted and all pairs of values of (n, d) that give the same normalized ratios can be retrieved.
When searching for a suitable ratio for a given value x, the code searches by the normalized value of x. After retrieving the suitable (n, d) pairs, either n or d in each pair is scaled by successive powers of 10 until the actual ratio of the scaled values of n and d is as close as possible to the original value of x.
For example, if the desired value is 2.54, the code identifies that (127, 5) and (254, 1) have normalized ratios of exactly 2.54. The actual ratios given by these pairs are 127/5 = 25.4 and 254/1 = 254. The code scales the first denominator by 10 to give 127/50 = 2.54, and the second denominator by 100 to give 254/100 = 2.54.
Some Results
So, how many unique values can be represented as ratios using the tick marks on a standard 25cm slide rule? Using the tick marks as described above, the code identifies 38,057 unique ratios.
The average gap between successive ratios is computed as 10(1/38057) = 1.0000605. In other words, the average gap between successive ratios is 60.5ppm. However, the gaps between ratios are not evenly distributed. The following chart shows the gap between successive ratios in ppm, ordered by successive normalized ratio values:
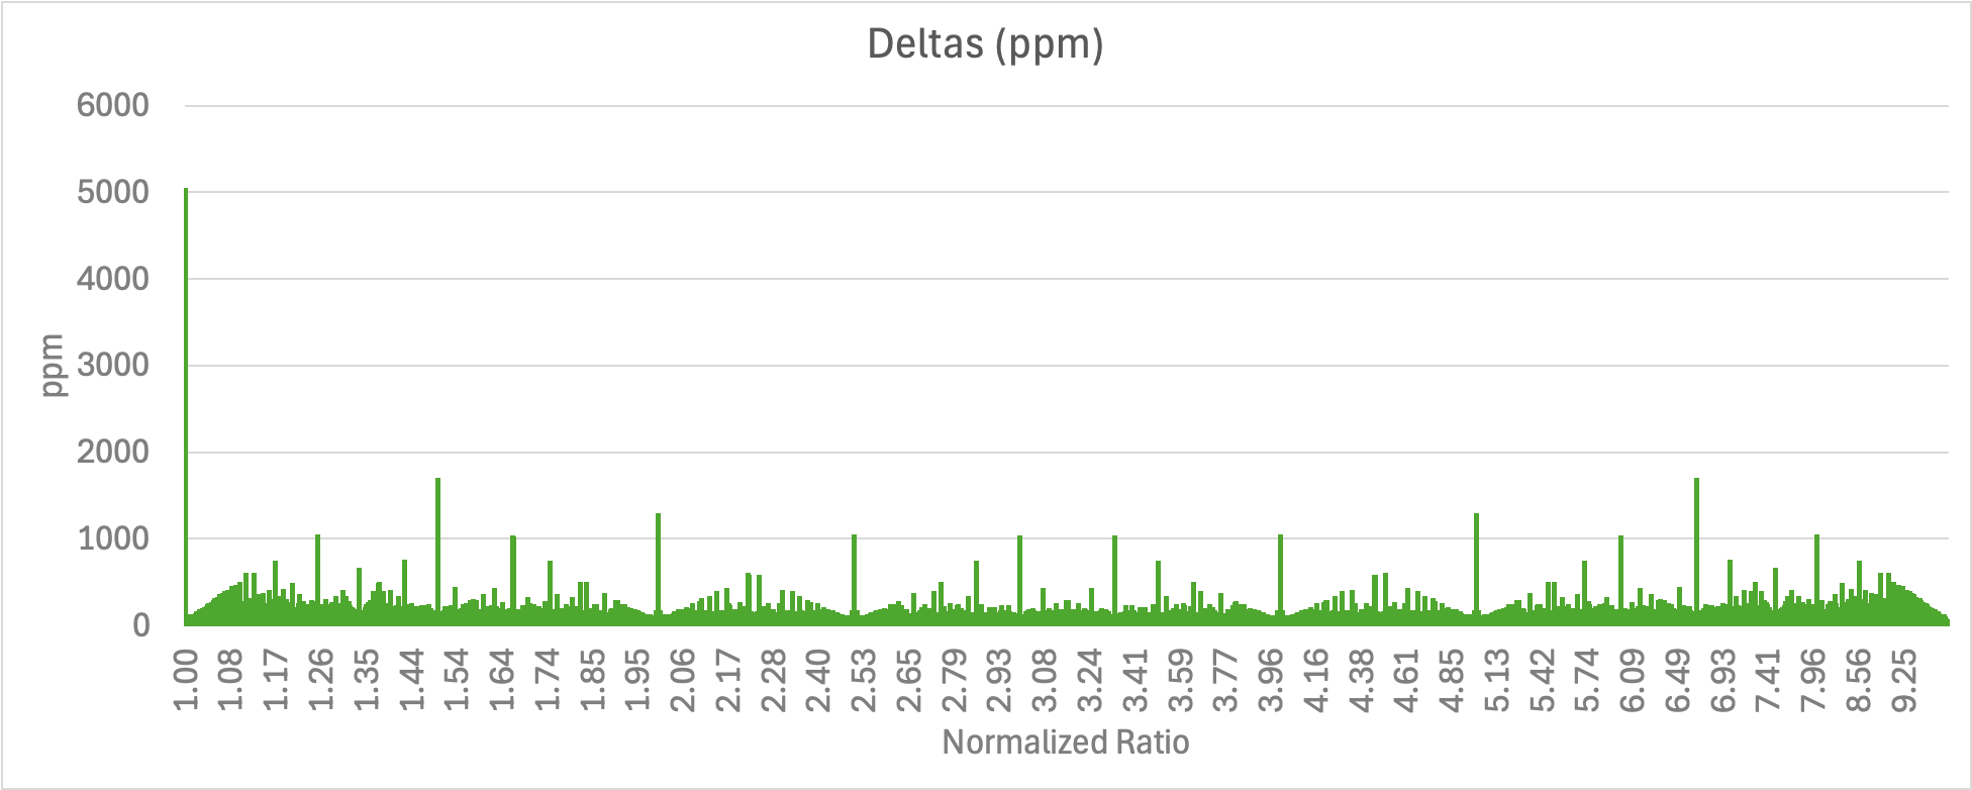
While the average gap between ratios is 60.5ppm, there are quite a few places where a larger gap is seen. The largest gap is between 1.0000 and 1.005025, which has a gap of about 5025ppm, or just over 0.5%.
The reason for this is that when the slide is aligned for a ratio of 1.00, each tick mark on the C scale is opposite the same tick mark on the D scales. The slide has to move a distance equal to the minimum distance between tick marks before two tick marks are once again opposite each other. This first occurs for the following three tick mark pairs, (199, 198), (398, 396), and (995, 990), which all have the same normalized ratio of 1.005025… At all other slide positions, the slide has to move a smaller amount to bring two tick marks together.
The worst case relative error that we can expect when approximating a value using ratios is mid-way between 1.00 and 1.005025. Since we are dealing with a log scale, the mid-point of these values is the geometric average of these two values, i.e., sqrt(1.005025/1.00) = 1.002509. So the worst case relative error occurs when approximating 1.002509, which will have a relative error of 2509ppm. This amount of error is clearly visible to the naked eye. Fortunately there doesn’t appear to be many conversion factors in this range.8
The next highest gaps between ratios are found at 1.5, 6.66667, 5, 2, 4 and 8. There are many ratios that equal these values, so many of the tick marks are aligned on each scale. The slide has to be moved a relatively long distance before tick marks are once again aligned with each other adjacent to these values.
Optimal Opps for the Concise 28R
Let’s compare the ratios shown on the Concise 28R with the most accurate and most user friendly ratios that the program identifies. The table below shows the 33 conversions in the table on back of the 28R for which ratios in the form X opp. Y are given.
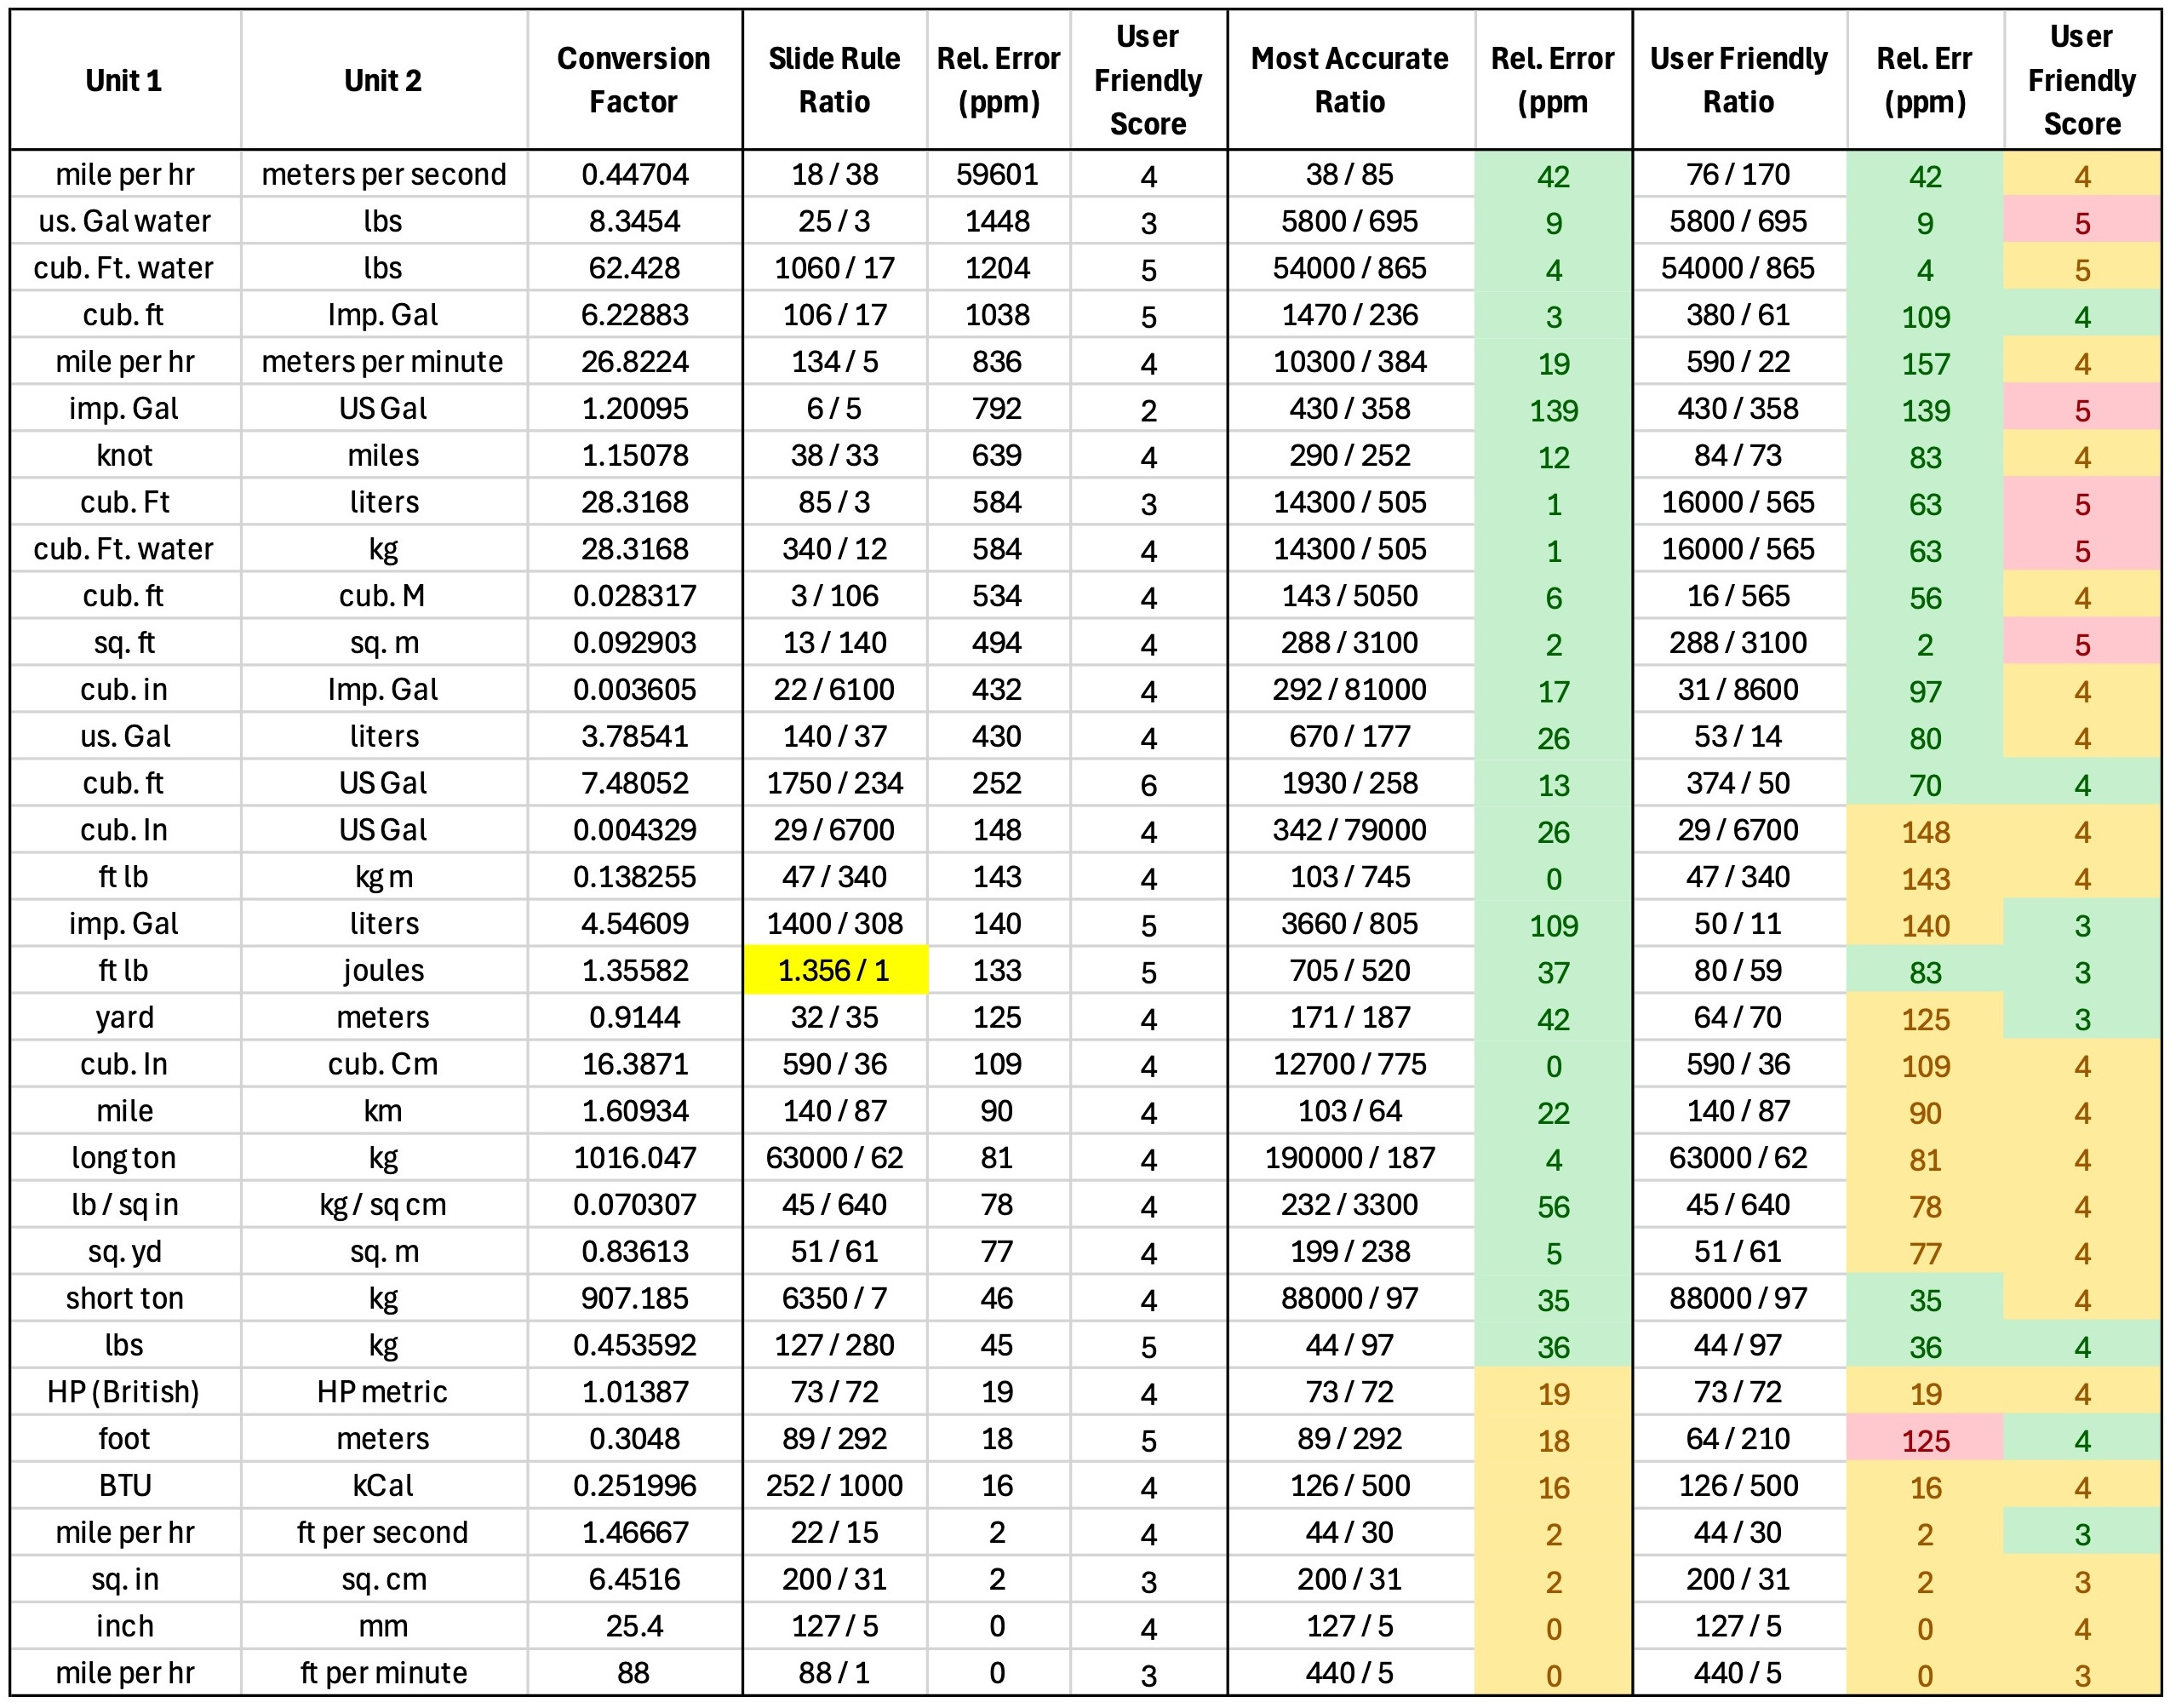
The decimal conversion factors for each ratio are shown next to the units being converted. Note that the decimal conversion factors shown in the table have more significant digits than the decimal values on the back of the 28N. All accuracy comparisons are done against these more accurate values.
The ratio for each conversion on the 28N is shown in the next column, followed by the relative error, and user friendliness score for the ratios.
The table is sorted by the relative error of each conversion factor. As can be seen, 13 of the ratios have a relative error of 430ppm or higher. Errors of 430 ppm or so start to be visible to the naked eye on a 25cm slide rule scale.
The Most Accurate Ratio column shows the most accurate ratio found by the program using the tick marks on the standard 25cm C or D scale. The relative errors of each most accurate ratio is shown in the next column. The largest relative error is 139ppm. The values are color coded - green means the ratio is more accurate than the ratio on the 28R, while yellow means the ratio has the same accuracy. 26 of the ratios found by the program are more accurate than the 28R ratios, with the other 7 ratios having the same accuracy.
When selecting the most user friendly ratios, the relative error was configured to be no more than 250ppm. In 12 cases the most user friendly ratio has the same relative error and user friendliness score as the ratio on the 28R. For all other cases, the most user friendly ratio either has a relative error that is better than the relative error of the ratio on the 28R, or it has a better user friendly score (lower is better), or both.
In the table, one of the ratios on the back of the Concise 28 is highlighted, i.e., 1.356 opp. 1. This ratio cannot be precisely set on the Concise 28N, nor on most 25cm slide rules, due to the absence of a tick mark at 1.356. As can be seen, the program found both a more accurate ratio, and a more user friendly ratio (that is also more accurate).
Conclusions
An error found in a ratio in the units conversion table on the back of a Concise 28N circular slide rule clone led to an investigation of the relative errors for the other ratios in the table. In turn, that led to a program to compute the optimal values to place opposite each other for unit conversions on slide rules. An analysis of all possible ratios that can be set using the tick marks on a standard 25cm rule showed that while most decimal conversion factors can be approximated to better than slide rule accuracy, for factors close to 1.0 the relative error can be as much as 2500 ppm, or 1 in 400.
The program was used to compute the most accurate and the most user friendly ratios for the conversion factors on the back of the 28N rule. More optimal ratios for each of these criteria were found for the majority of conversion ratios.
The program can be used to compute optimal opps for the conversion tables on other slide rules, e.g., early K&E, Dietzgen and Faber rules. I have provided the program code, notes on how the code is structured and how to use the program below. Feel free to try it out. Leave a message in the chat if you find any other interesting opps, or if you have any questions about running the program.
Optimal Opps Program Code
The optimal opps code shown below is written in Python 3, and has been tested with Python 3.10 and above. It only uses built-in modules found in the the Python standard library.
The list of conversion factors is hard-coded in the main function. Some examples are provided in the code.
Instead of using the values 1.00, 1.01, etc. for the tick marks, the code uses 101, 102, etc. This ensures that the numerator and denominator are always integers.
The code also removes trailing zeros from these values, so 800 becomes 8, 220 becomes 22, etc. The code also computes the ease of use score for each value at this time, i.e., the number of digits after trailing zeros have been removed.
To determine if two ratios are the same or not, we need to consider potential floating-point roundoff issues. Two ratios may be equal, but evaluate to slightly different floating point representations. Therefore we can’t just compare the floating point representations of the ratios for equality. We could consider floating point values that differ by less than a threshold as equal. However, the code does a safer comparison using the integer math.
Consider two ratios, r1 = n1 / d1 and r2 = n2 / d2, where n1, d1, n2 and d2 are all integers. If the ratios are equal, then we have n1*d2 = n2*d1. Note that we want to consider normalized ratios as being equal. In the code, we take the minimum of (n1*d2) and (n2*d1) and multiply that by 10 until it is greater than or equal to the maximum of (n1*d2) and (n2*d1). If the values are equal then the ratios are the same, otherwise they are not.
When finding the ratio that is closest to a given value x, the code first normalizes x so it falls in the range 1 to 10. The normalized value of x is used to find the optimal ratio in the table of pre-computed ratios. Then either the numerator or denominator value corresponding to a normalized ratio is multiplied by 10 until the actual ratio is close to x. This ensures that each ratio is approximated by integer numerator and denominator values.
import math
import bisect
import copy
from operator import attrgetter
from dataclasses import dataclass
from time import time


# Function to normalize a value to the range 1 to 10.
def normalize(n: float) -> float:
    return n / (10 ** math.floor(math.log10(n)))


# Function removes trailing zeros from an integer x
def remove_trailing_zeros(x: int) -> int:
    # removes trailing zeros from an integer x
    return int(str(x).strip(’0’) if x != 0 else “0”)


# Function counts the number of significant digits in an integer
def count_significant_digits(x: int) -> int:
    return len(str(abs(x)).strip(’0’)) if x != 0 else 1


# Normalized Ratio Class
class NormalizedRatio:
    def __init__(self, num, den):
        self.num = remove_trailing_zeros(num)
        self.den = remove_trailing_zeros(den)
        self.value = normalize(num / den)
        self.score = count_significant_digits(num) + count_significant_digits(den)

    def __eq__(self, other):
        # two ratios are equal if self.num * other.den == self.den * other.num * 10^x, where x is an integer.
        x1 = self.num * other.den
        x2 = other.num * self.den

        x1, x2 = min(x1, x2), max(x1, x2)
        while x1 < x2:
            x1 *= 10

        return x1 == x2

    def __lt__(self, other):
        # Simply compare values.
        return self.value < other.value

    def relative_diff(self, x):
        ratio = normalize(x) / self.value
        return ratio - 1 if ratio > 1 else 1/ratio - 1

    def match(self, value):
        # Find values for num and den that come closest to the given value.
        # Keep multiplying numerator by 10 until num/den is no less than value / sqrt(10)
        # Keep multiplying denominator by 10 until num/den is no greater than value * sqrt(10)
        num = self.num
        den = self.den

        while num / den < value / math.sqrt(10):
            num *= 10

        while num / den > value * math.sqrt(10):
            den *= 10

        return num, den, num / den, self.relative_diff(value), self.score

    def __str__(self):
        return f”{self.num} / {self.den} = {self.value:.6f} (score: {self.score})”


@dataclass
class RatioMatch:
    num: int
    den: int
    value: float
    rel_diff: float
    score: int

    def __str__(self):
        return f”{self.num} / {self.den} = {self.value:.6f} (rel. diff: {self.rel_diff * 1e6:.0f}ppm, score: {self.score})”


# Function to return the tick values on a rule
def get_tick_vals(rule_type=”standard”):
    tick_values = []
    # Standard 10” Slide rule tick positions
    if rule_type in (”25cm”, “standard”, “”):
        tick_values = list(range(100, 200, 1)) + list(range(200, 400, 2)) + list(range(400, 1000, 5))

    elif rule_type == “test”:
        tick_values = list(range(1, 6))

    print(f”Number of ticks: {len(tick_values)}”)

    return tick_values


def compute_all_combos(tick_values):
    # ratios is a list of Ratio objects, one for each possible combination of ticks, sorted by the ratio value
    ratios = sorted([NormalizedRatio(num, den) for num in tick_values for den in tick_values])

    # Group ratios with the same value together
    # grouped_ratios is a list of dicts of type: {”closest”: Ratio object, “best_matches”: List of Ratio objects}
    grouped_ratios = []
    for ratio in ratios:
        if grouped_ratios and ratio == curr_group[”closest”]:
            # Append ratio to list of ratios with same value
            curr_group[”best_matches”].append(ratio)

            # If new combo has a score lower than previous lowest score, then replace previous lowest with new lowest
            if ratio.score < curr_group[”closest”].score:
                curr_group[”closest”] = ratio
        else:
            curr_group = {
                “closest”: ratio,
                “best_matches”: [ratio]
            }

            grouped_ratios.append(curr_group)

    # Copy the last combo to the front and the first combo to the end to prevent index errors when searching.
    # Make sure to make an actual copy and not just use references when updating list.
    grouped_ratios = [copy.deepcopy(grouped_ratios[-1])] + grouped_ratios + [copy.deepcopy(grouped_ratios[0])]

    # Adjust the copied values so everything is still sorted correctly
    grouped_ratios[0][”closest”].value /= 10
    grouped_ratios[-1][”closest”].value *= 10

    return grouped_ratios


def get_matching_ratios(ratios, value, tolerance=0.0025):
    “”“
    :param ratios: List of Ratio objects, sorted by value.
    :param value: Value to be approximated
    :param tolerance: allowable tolerance. Default tolerance = 0.05% (0.0005)
    :return: List of RatioMatch objects.”“”

    # min and max values within tolerance
    norm_val = normalize(value)

    lo_val = norm_val / (1 + tolerance)
    hi_val = norm_val * (1 + tolerance)

    # Find indices of values greater than or equal to lo_val and less than or equal to hi_val
    # combos[lo_idx:] are all greater than or equal to lo_val
    lo_idx = bisect.bisect_left(ratios, lo_val, key=lambda x: x[”closest”].value)
    hi_idx = bisect.bisect_left(ratios, hi_val, key=lambda x: x[”closest”].value)
    best_idx = bisect.bisect_left(ratios, norm_val, key=lambda x: x[”closest”].value)

    if ratios[best_idx - 1][”closest”].relative_diff(value) < ratios[best_idx][”closest”].relative_diff(value):
        best_idx -= 1

    closest = ratios[best_idx][”closest”]
    closest_match = RatioMatch(*closest.match(value))

    good_matches = []
    for entry in ratios[lo_idx:hi_idx]:
        for rat in entry[”best_matches”]:
            good_matches.append(RatioMatch(*rat.match(value)))

    if len(good_matches) == 0:
        good_matches = [closest_match, ]

    # sort good_matches, first by score, then by error
    good_matches = sorted(good_matches, key=attrgetter(”score”, “rel_diff”))

    return closest_match, good_matches


if __name__ == “__main__”:

    t0 = time()
    # ticks = get_tick_vals(”test”)

    ticks = get_tick_vals(”standard”)

    combos = compute_all_combos(ticks)

    print(f”number of unique values: {len(combos)}”)
    print(f”Average ratio = {((10 ** (1 / len(combos))) - 0) * 1:.8}”)

    # vals = [2.54, 1 / 2.54, math.pi, math.exp(1)]

    # Values below are for the conversions on the Concise 28N
    vals_str = “”“
0.44704
8.3454
62.428
6.22883
26.8224
1.20095
1.15078
28.3168
28.3168
0.028317
0.092903
0.003605
3.78541
7.48052
0.004329
0.138255
4.54609
1.35582
16.3871
1016.047
0.070307
0.83613
907.185
0.453592
1.01387
0.251996
1.46667
6.4516
0.9144
1.60934
0.3048
25.4
88
“”“

    vals = [float(x) for x in vals_str.split()]

    tol = 0.000250 # 0.0250% = 250 ppm

    for v in vals:
        closest_ratio, all_matches = get_matching_ratios(combos, v, tol)
        simplest_ratio = all_matches[0]
        print(f”{v}: Closest Ratio:  {closest_ratio}”)
        print(f”{v}: Simplest Ratio:  {simplest_ratio}”)
        curr_score = all_matches[0].score
        for m in all_matches:
            if m.score > curr_score:
                print(”     ---”)
                curr_score = m.score
            print(f”     {m}”)

    t1 = time()

    print(f”\n\nElapsed time = {t1 - t0:.3}s”)
Brand new 28N’s and several other Concise slide rules can still be purchased online, e.g., from ebay.com, amazon.com, or direct from the Concise website: https://www.sliderule.tokyo/products/list.php. Although the conversion table on the back of the current iteration of the 28N only shows the decimal conversion values, and no ‘opps’.
Pretty much every time I see a Concise 28N conversion table I check. If you have a Concise 28N with the conversion table that shows a ratio that is not 38 opp. 18, please do let me know.
See the entry from Alan Williams on page 6 of the UKSRC Newsletter No. 58, January 2025 https://osgalleries.org/newsletter_and_bulletin/UKSRC_Newsletter_No_58.pdf
Another possibility is that Blundell deliberately introduced this error as a form of Copyright Trap, to allow them to detect if anyone had directly copied their rules. If so, then I would expect that similar ‘errors’ should be found on other Blundell rules.
The bars mean magnitude of the value. For example |-3.14159| = 3.14159.
To compute the linear distance lin_dist between two values x1 and x2 on a logarithmic scale with a single cycle scale length of scale_len, use the formula:
lin_dist = scale_len * abs(log10(x1) - log10(x2))
The code uses the values 100 to 1000 for the tick marks. This way, each tick mark has an integer value, which simplifies some of the code.
Although if you ever want to convert ounces per cubic foot to kilograms per cubic meter using your slide rule (conversion factor = 1.0012), then you might just have to live with the 0.11% relative error.
Not that I have thought about this very much, but this is a thoughtful and well executed method to determine the percentage of error in using tabulated conversion factors on the back of many slide rules. I will have to check this on some others. One thing - you did not include my favorite conversion factor of furlongs per fortnight to meters per second. I actually had that on a physics test, and nobody knew how long a furlong was. :)
Great analysis and well written article, Eamonn!